Basic Queries
Creating a new query
To analyse data in Saiku we need to create a query. To do this once you have logged into Saiku you can click the Create New Query quick link button on the splash screen
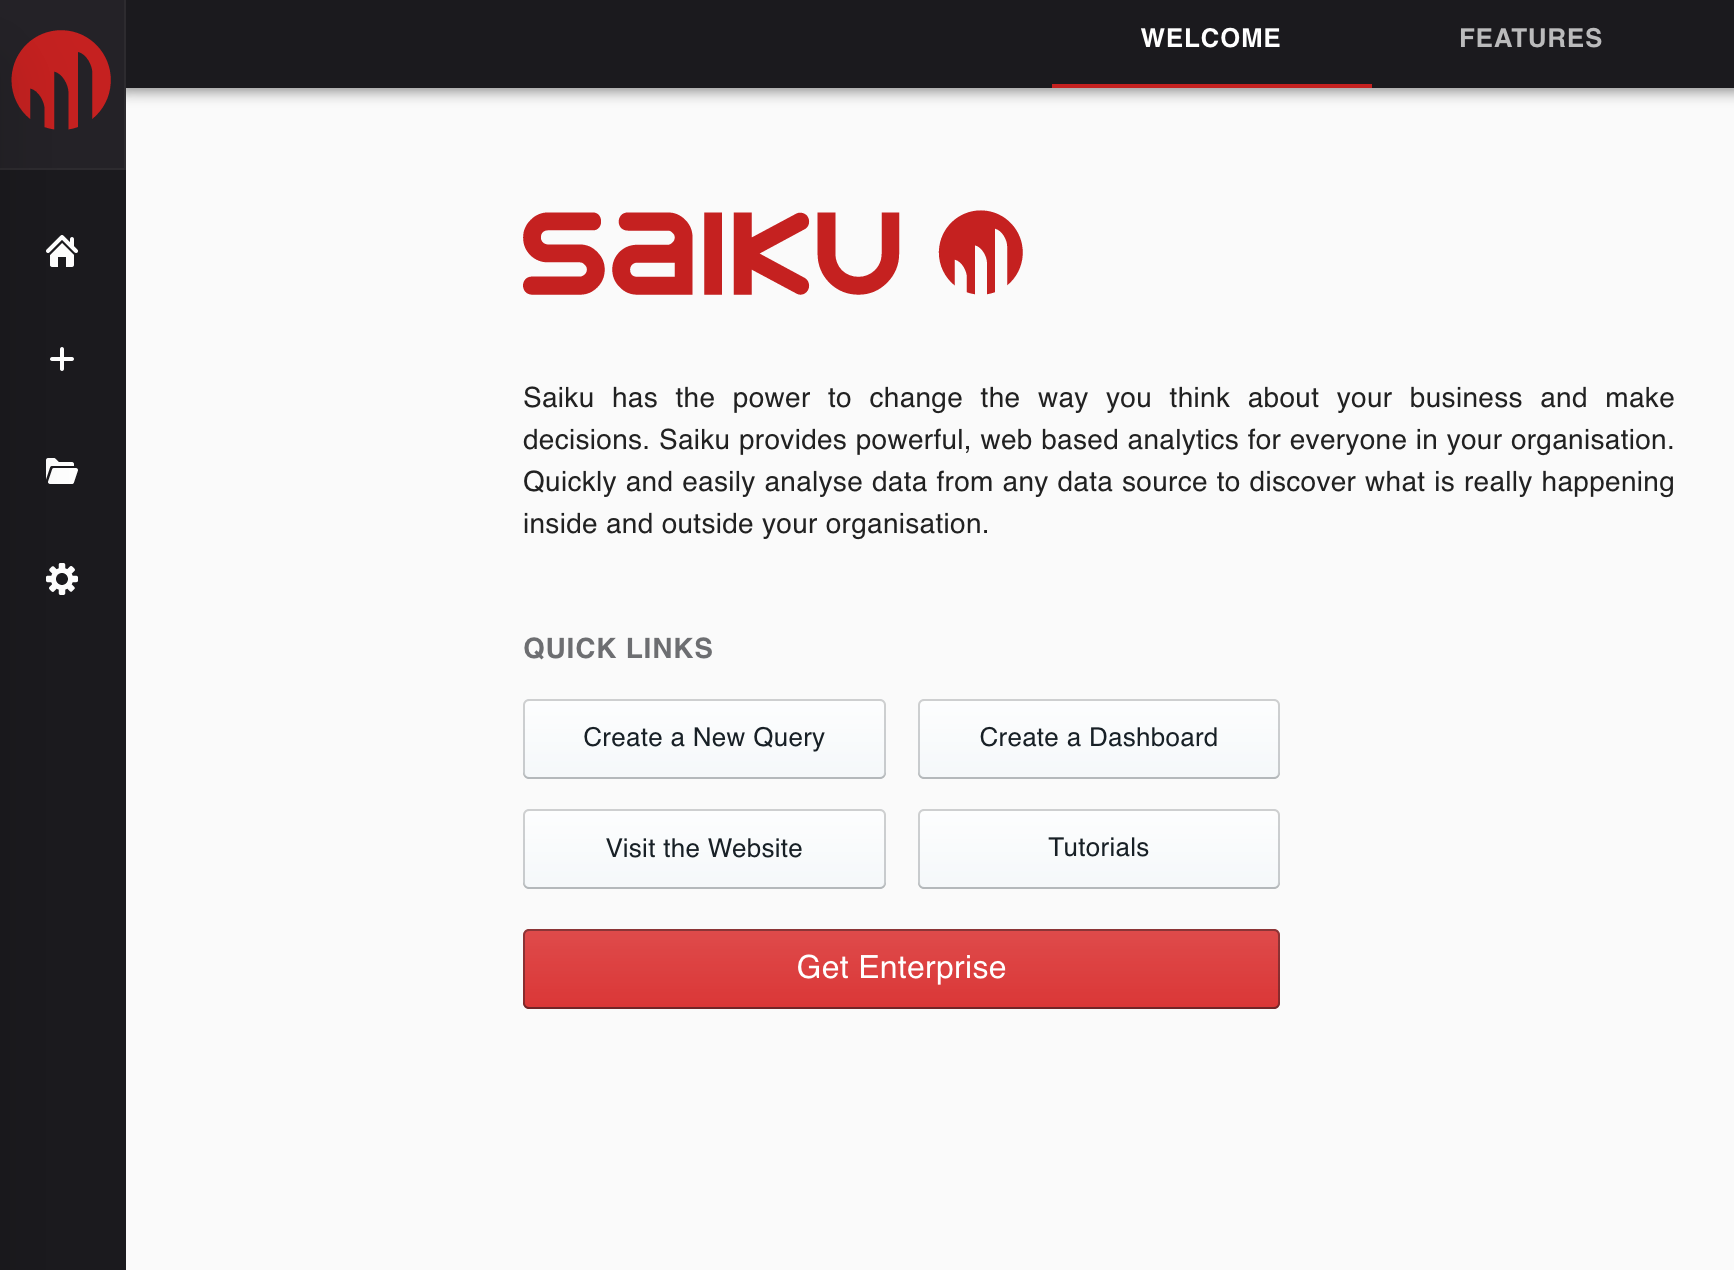
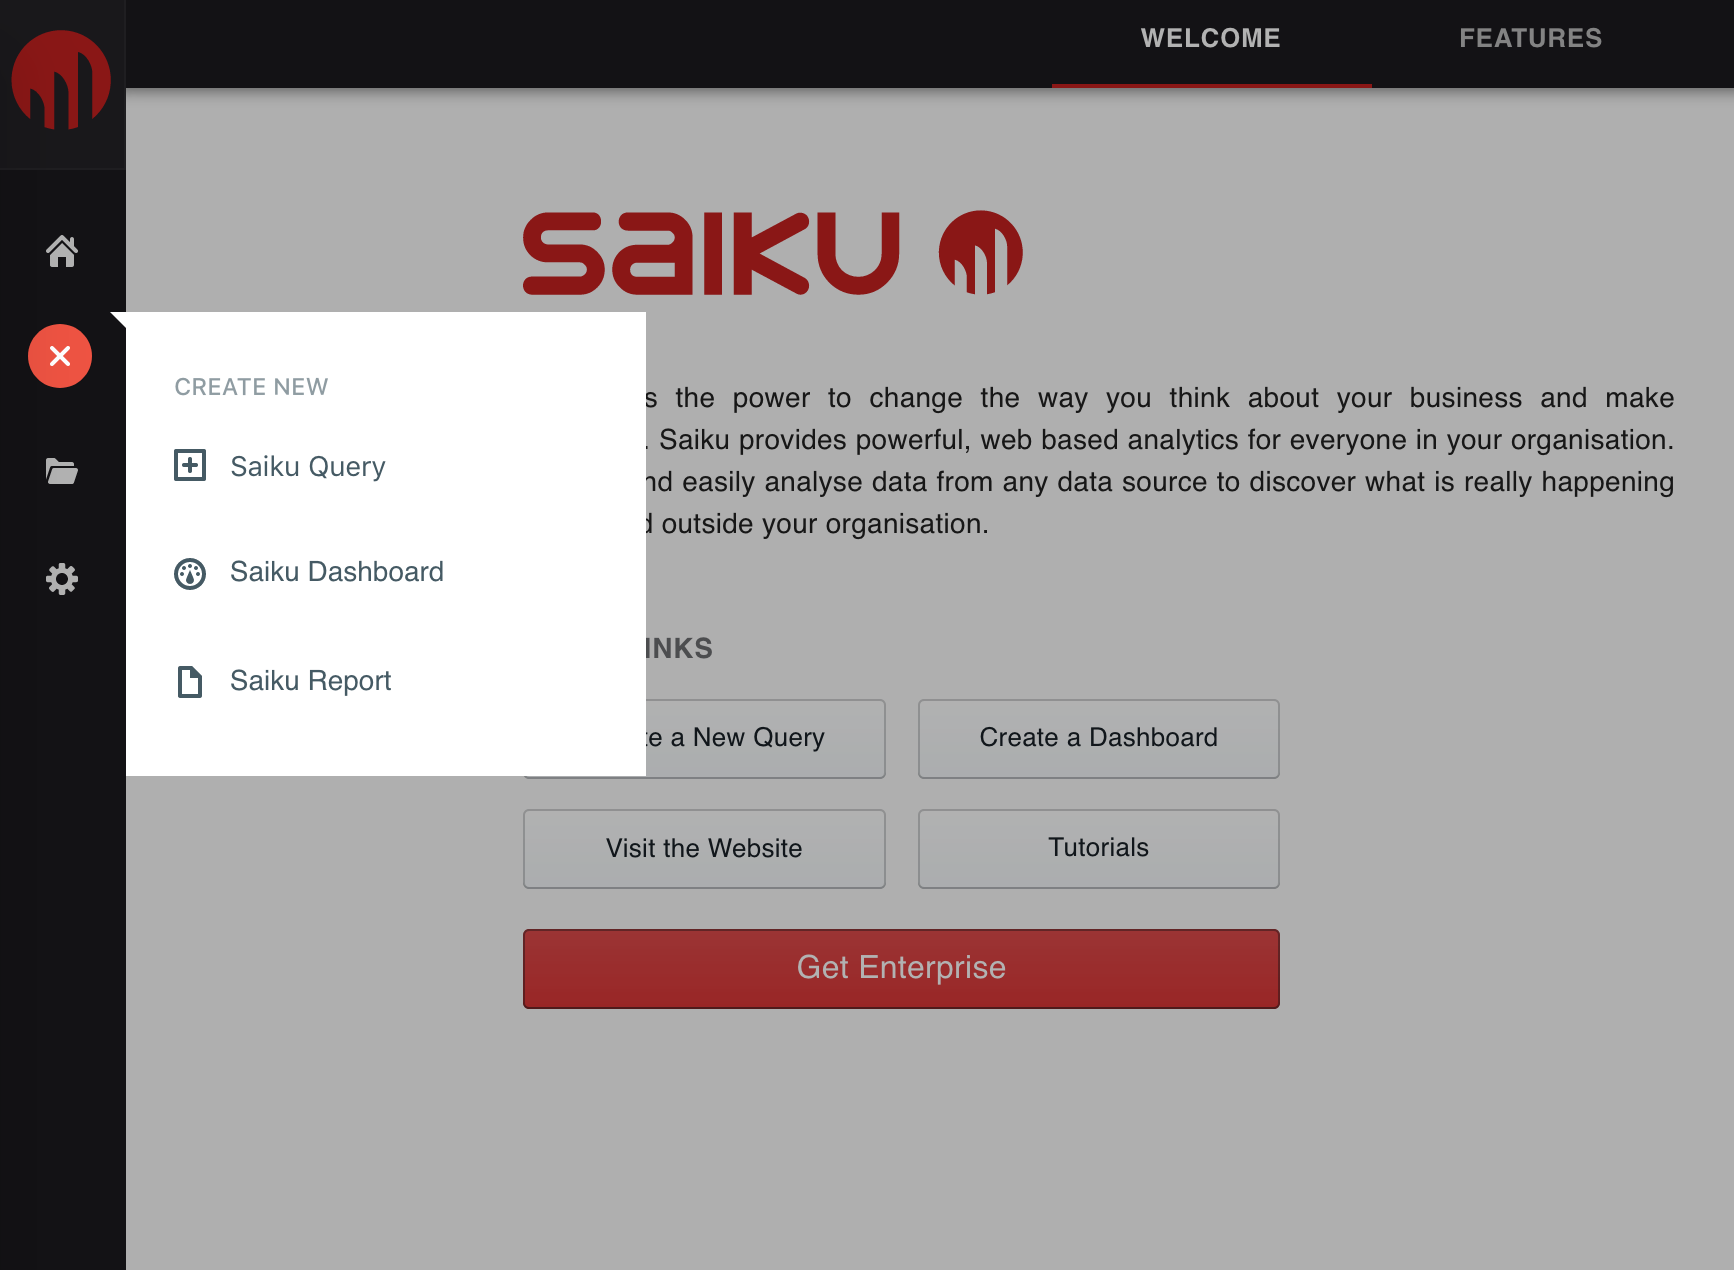
or the plus icon on the left toolbar and then Saiku Query.
You’ll then be presented with an empty workspace.
![]()
Welcome to your query workspace
Your query workspace is where you do all the design and visualisation of your current Saiku query.
Selecting a cube
To get started you need to select a cube to work from. You can use the sample cubes if you don’t have one of your own, or to design your own visit our Schema Design section.
You should see the Schema and Cube you want to use in the list when you hit the Select Schema button.
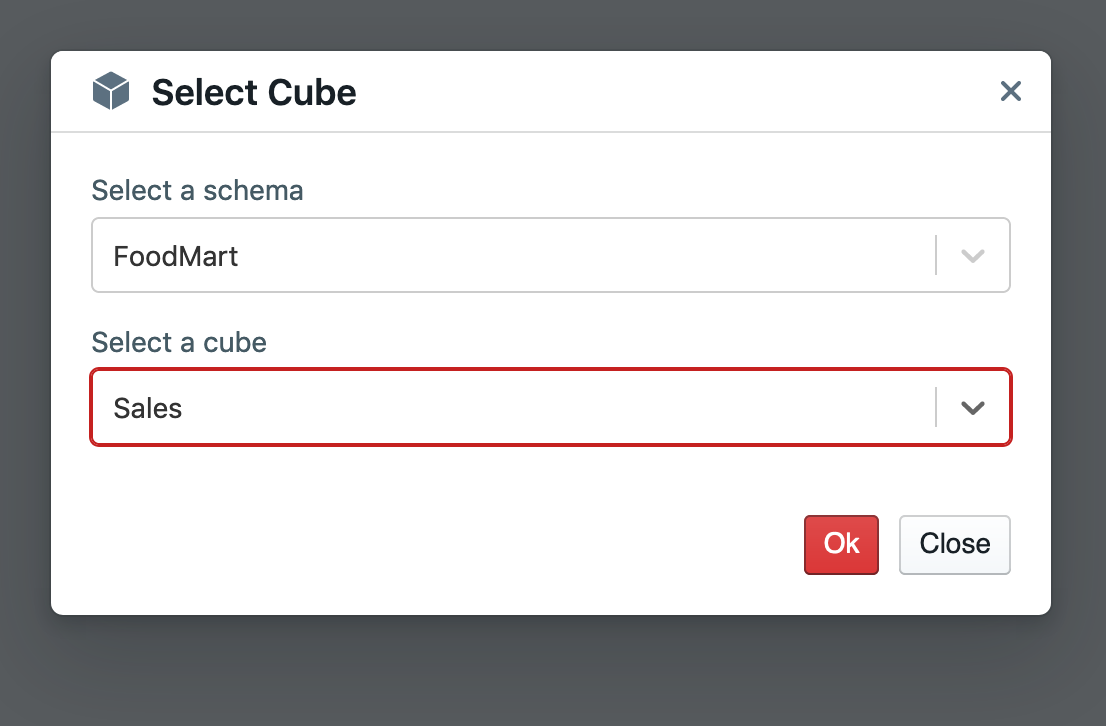
Once you’ve selected them just press the okay button.
Query Designer
Next you need to start designing your query. Press the Query Designer button and you’ll be presented with a popup window that allows you to move your dimensions and measures around the various Axis in your query.
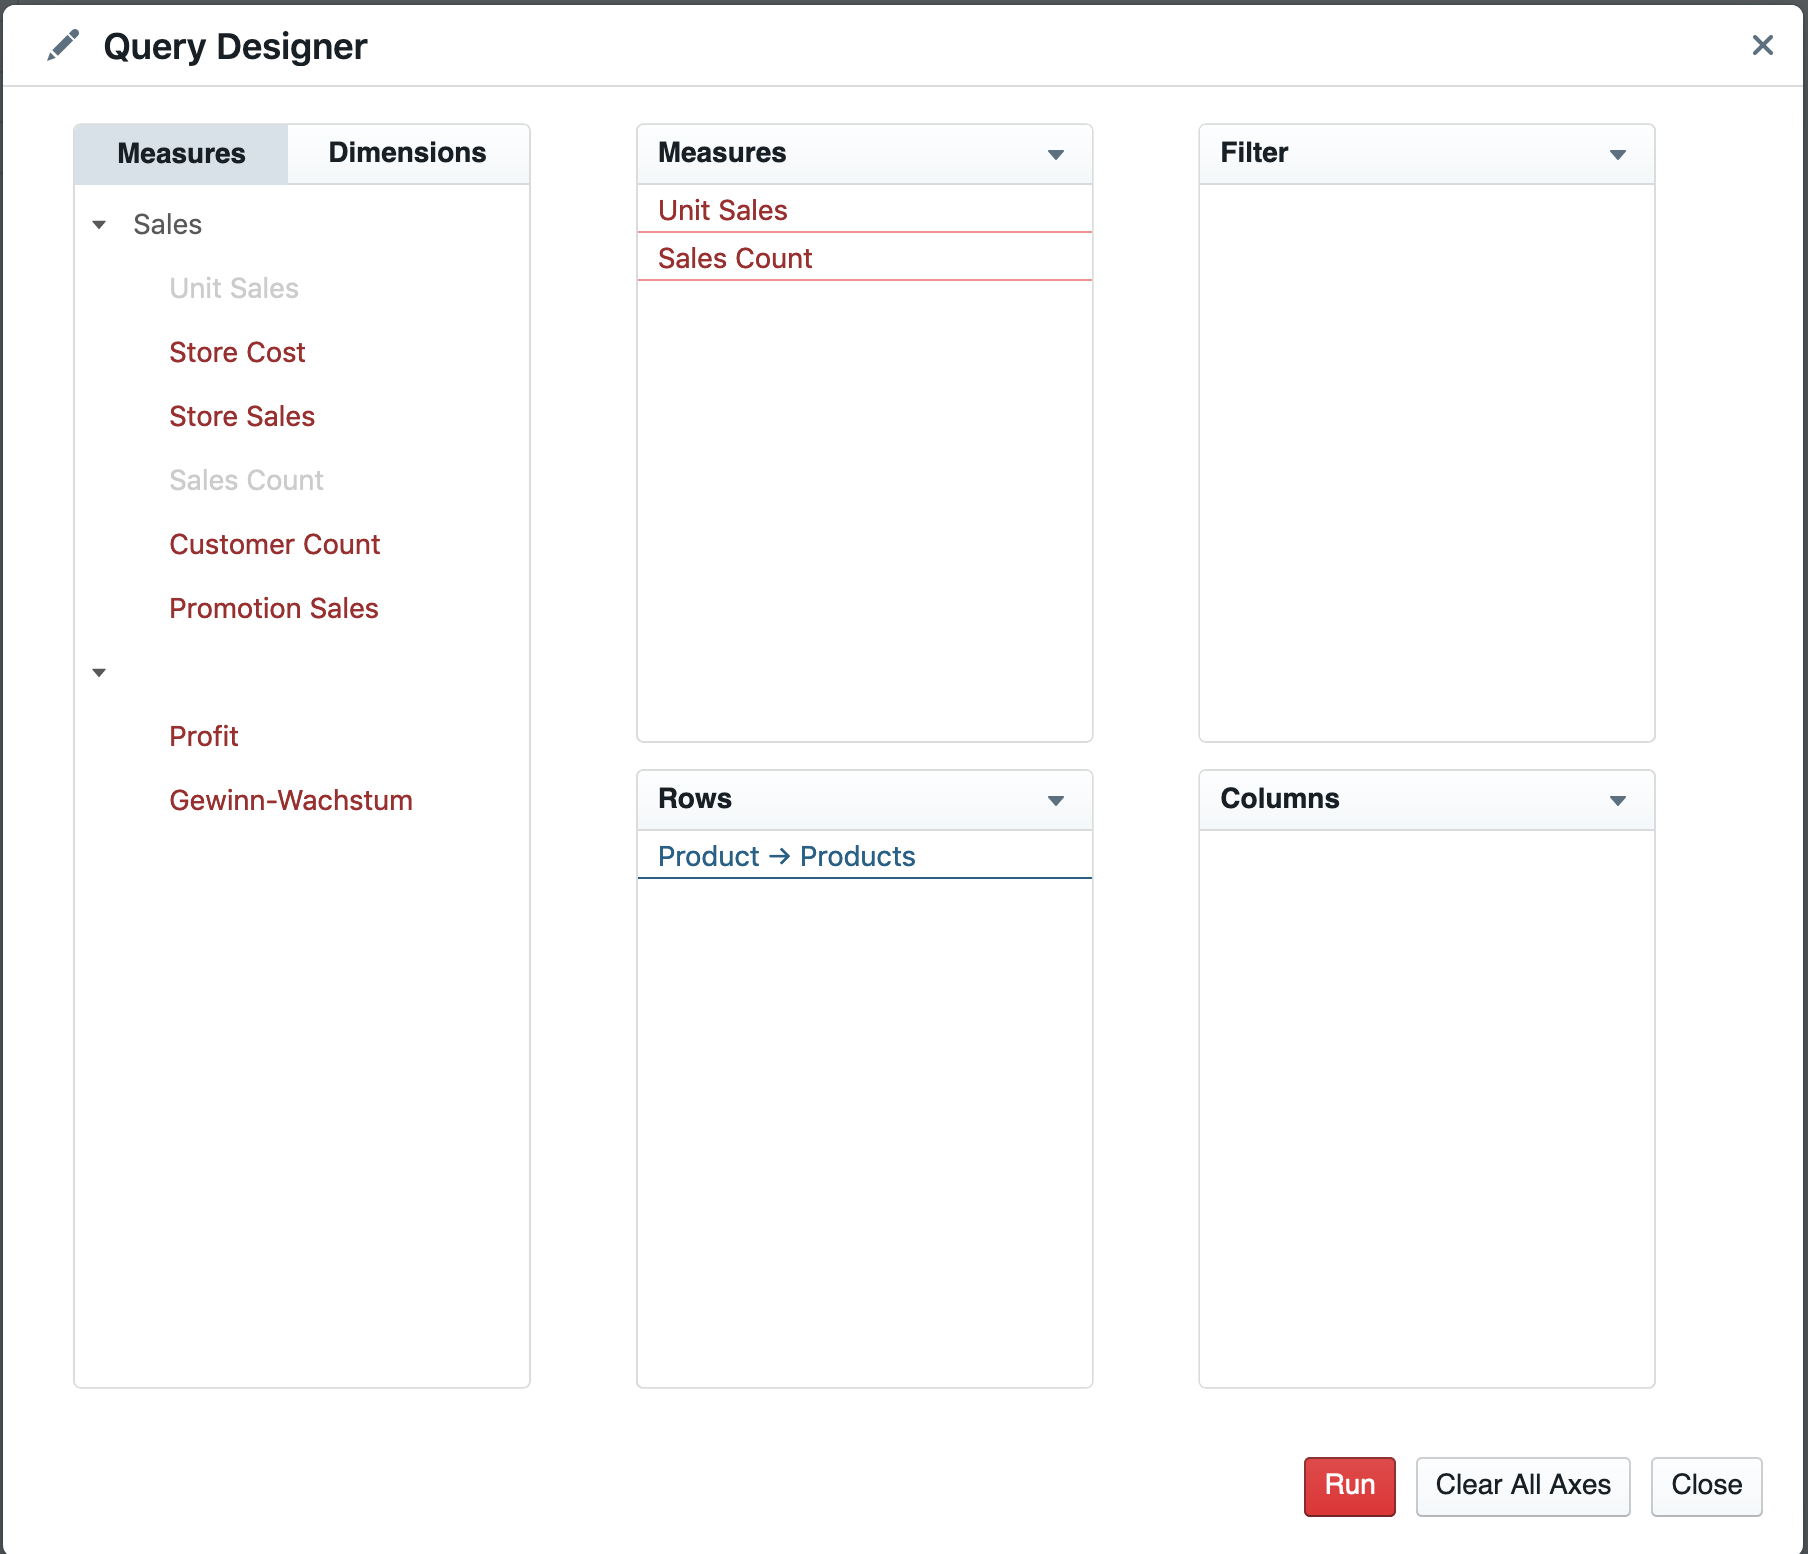
To build the most simple query you need to drop a dimension onto the Rows Axis and one measure onto the Measures axis. Once you have done thids you can then press the run button and once your query is executed you will be displayed a table of data that is the result set of your query.
If you want to make changes to your query you can click the pencil icon in the toolbar to be returned to the query designer window where you can then drag more dimensions and measures around to make more complex queries.
MDX Axis
MDX queries actually have up to 128 axis. In reality though we use 3:
- ROWS
- COLUMNS
- FILTER
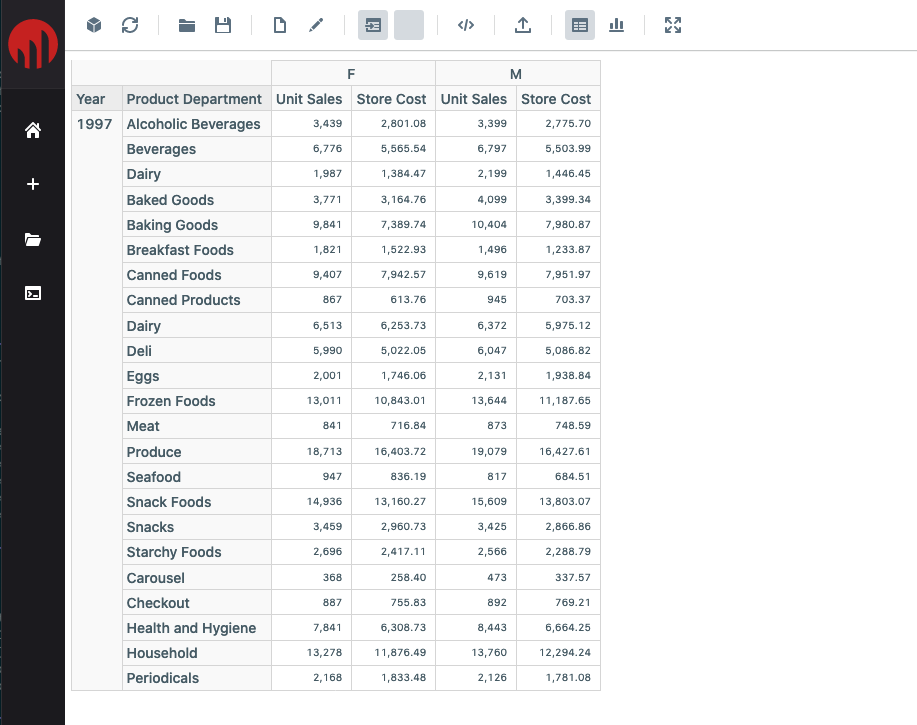
Rows and columns are obvious enough, if you put a level onto either of these it will show the data on either rows or columns. The other thing you can do easily with Saiku is nest different levels, so if you wanted to see Product Categories and Years on one axis and Gender on another thats easy to do.
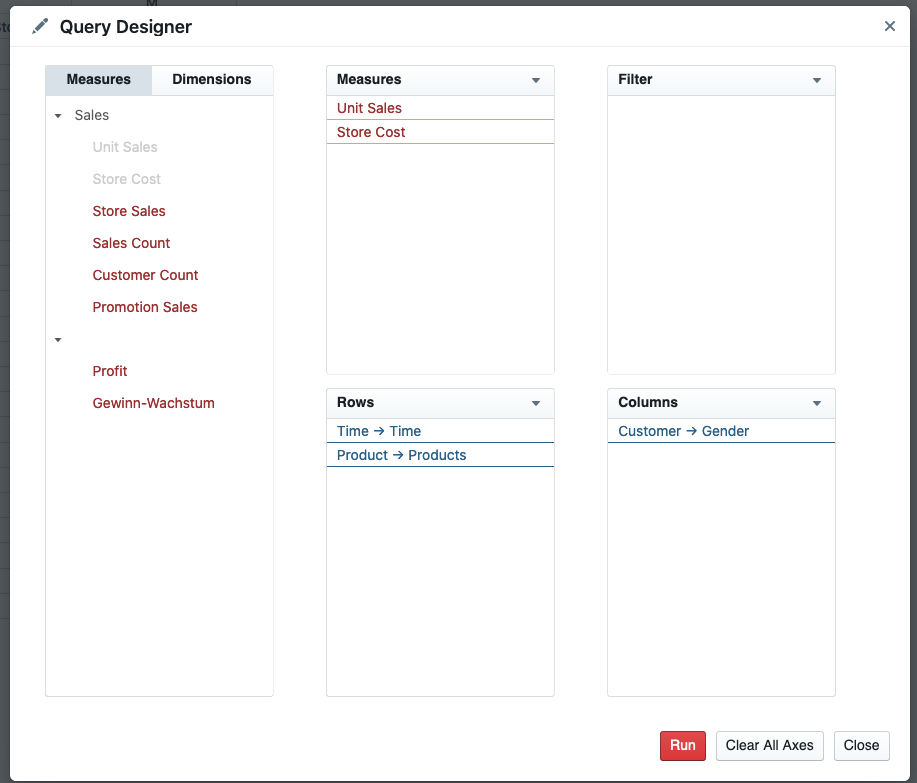
would look like this
But what does filter do?
Filter Axis
The Filter Axis is a special axis in MDX. Similar to the Where clause in an SQL query, it allows users to filter on data without rendering it in the tables.
For example if you wanted to show a query where it was limited to data from 2019, you could put Year into the Filter axis and then select 2019 as the filter value and so the table would only show 2019 data but without taking up table space with Year as a column or row.
Saving your query
To save your query, just click the save icon in the toolbar. You’ll be displayed a popup window with the available folders for you to save your query into.
Select one then enter a name in the bar at the bottom of the window and press the save button.
Displaying charts
If you want to visualise your data in a chart format, you can select the Chart icon on the toolbar and then the chart type you want.

Feedback
Was this page helpful?
Glad to hear it! Please tell us how we can improve.
Sorry to hear that. Please tell us how we can improve.