Getting Started
Saiku is designed to be very easy to get started with.
The quickest way to get up and running is to use our pre configured Docker image:
docker run -v /storage:/tmp -p 80:80 registry.gitlab.com/spiculedata/saiku4/saiku4-docker
Saiku ships with a few example data sources to get you up and running.
First grab a license from…..
Once you’ve got it installed you should be able to login at http://localhost:8080
Using the credentials admin/admin.
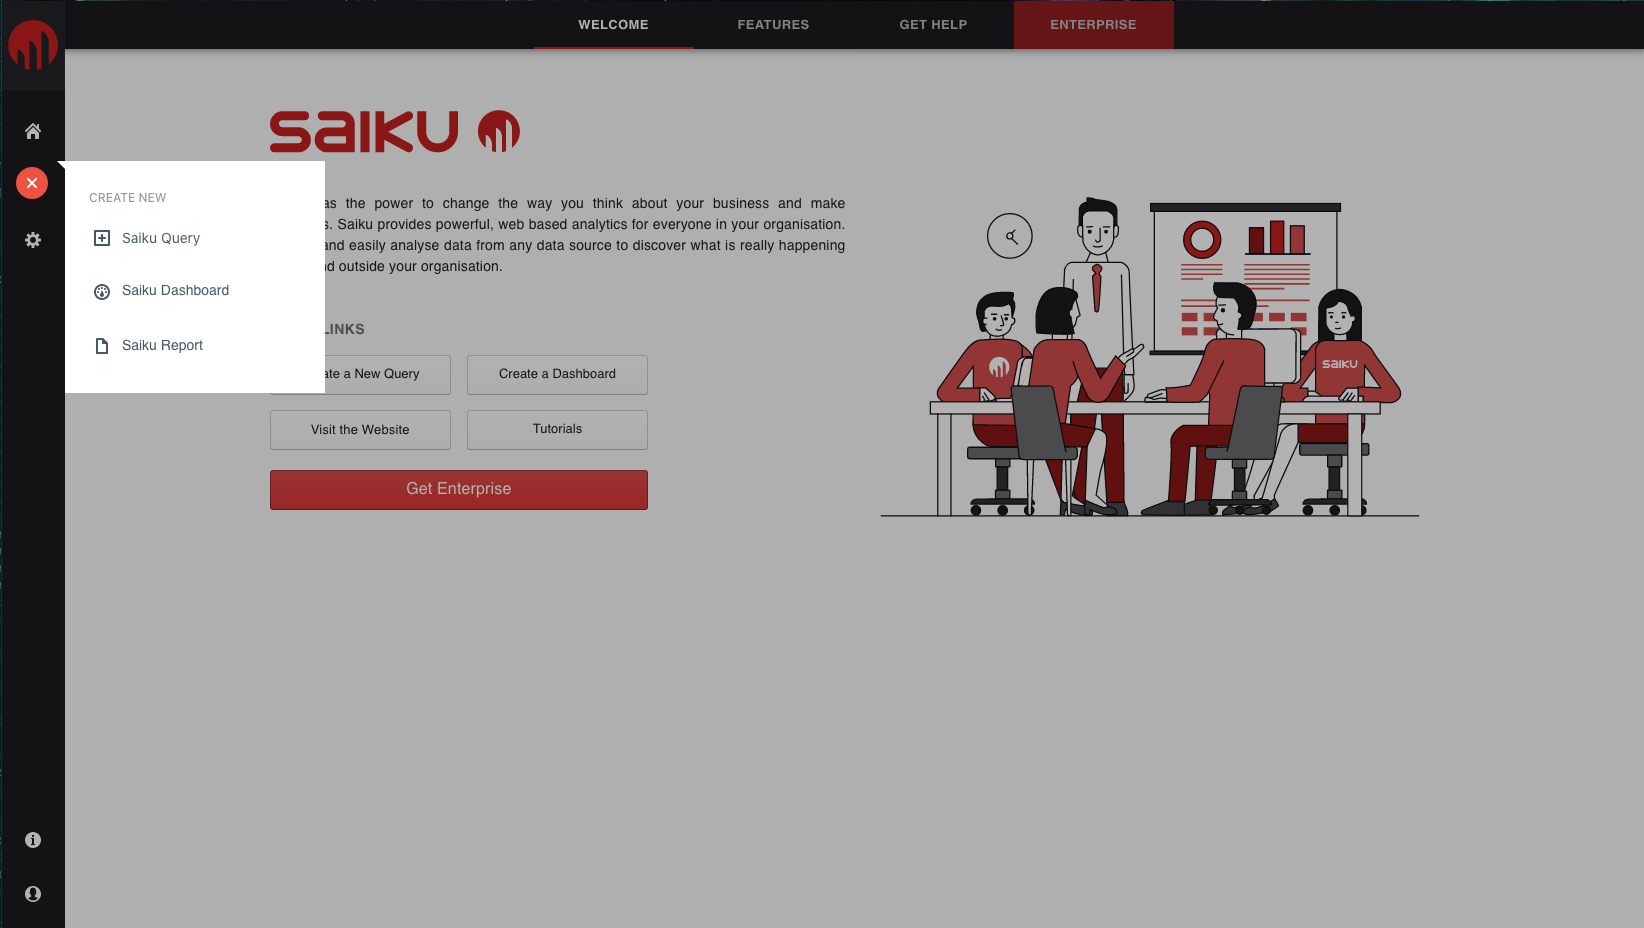
Now you’re logged in you can create a new query using the menu bar on the left.
Next you need to select your schema and cube and after you’ve done that you’ll be dropped into the Query Designer screen.
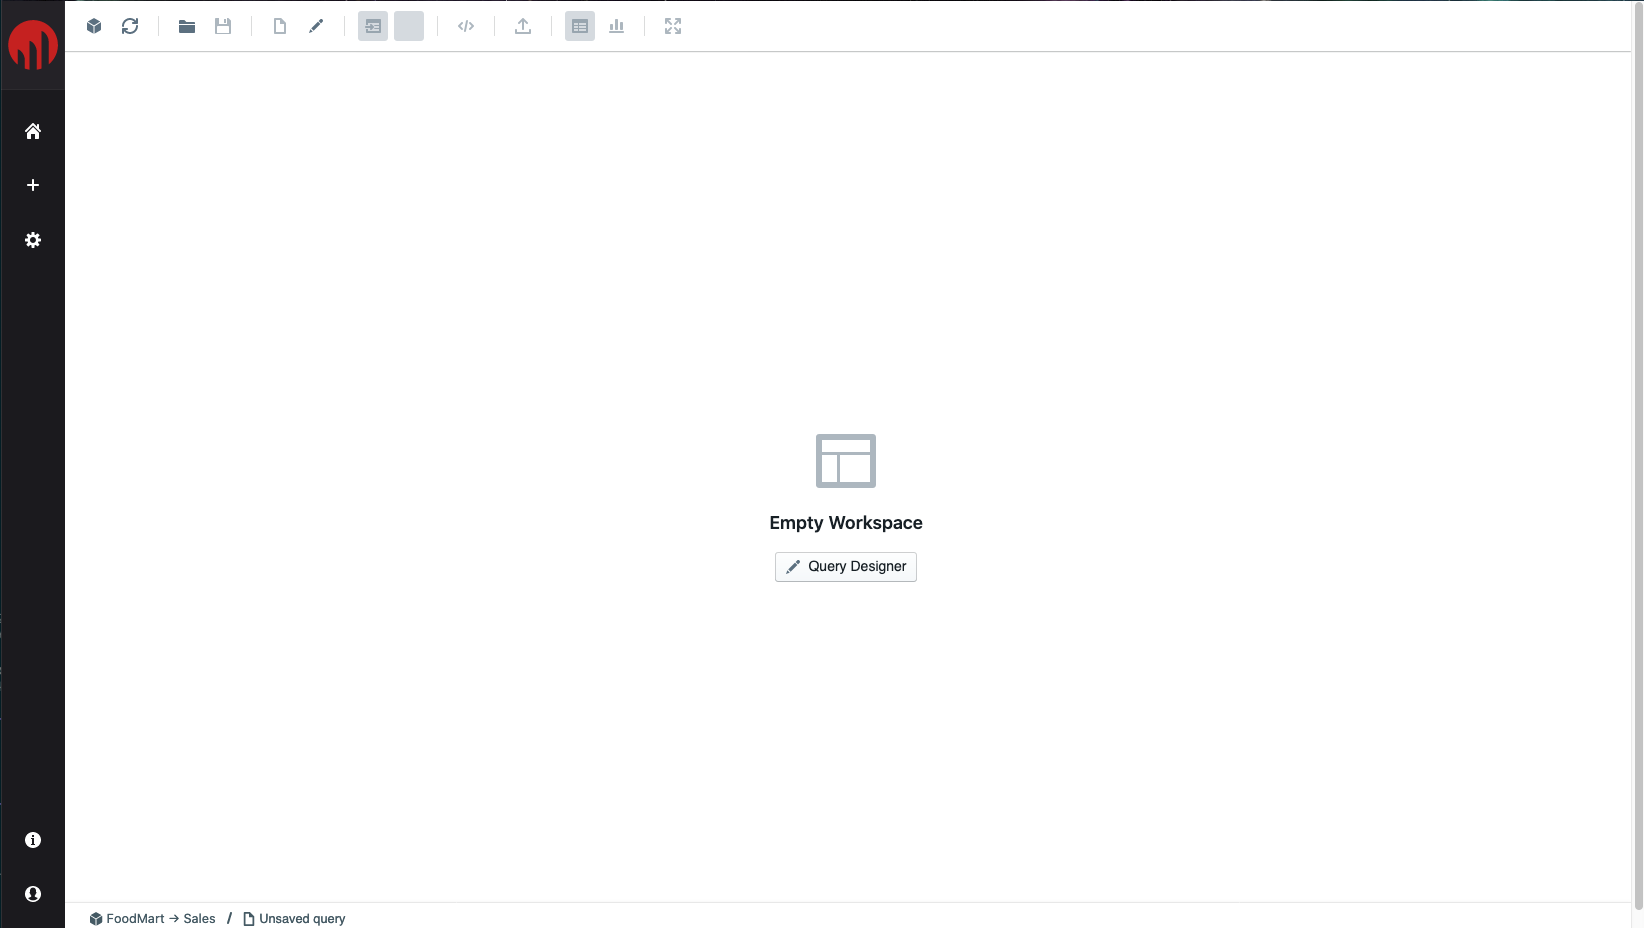
Clicking on the Query Designer button will pop up a new window. This window allows you to decide how to structure your query. To do so drag measures into the measures dialog and levels from dimensions into the Rows, Columns and filter boxes. Think of the filter axis like the Where clause in an SQL query.
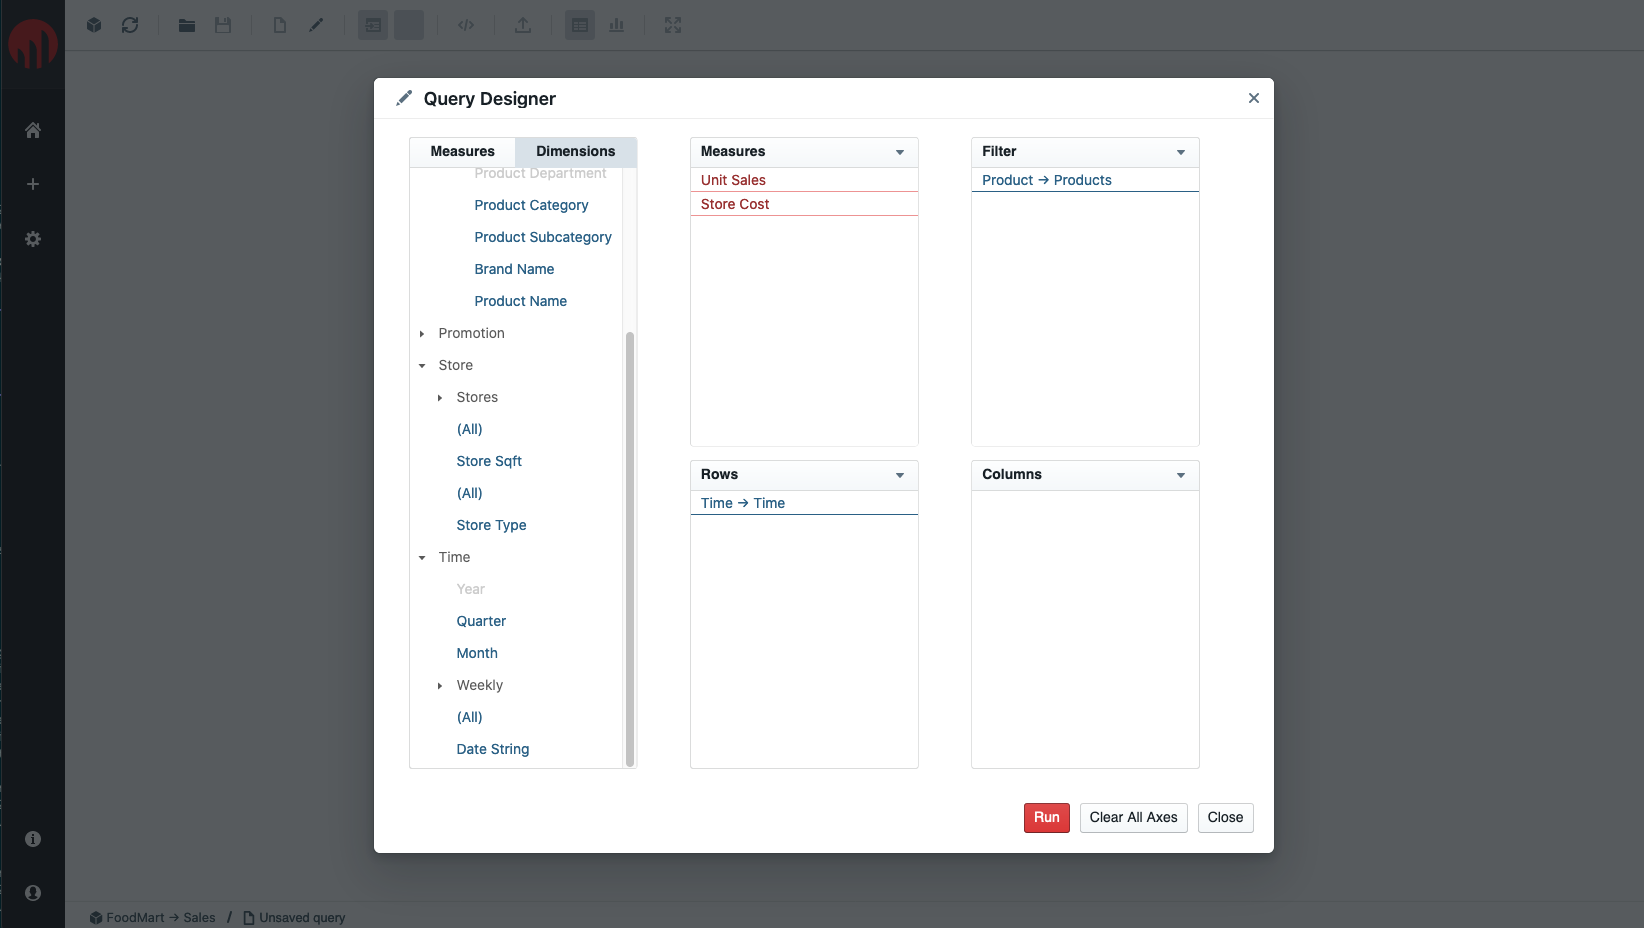
Once you’re happy with the design press the Run button.
You’ll then be presented with a table showing the output of that query.
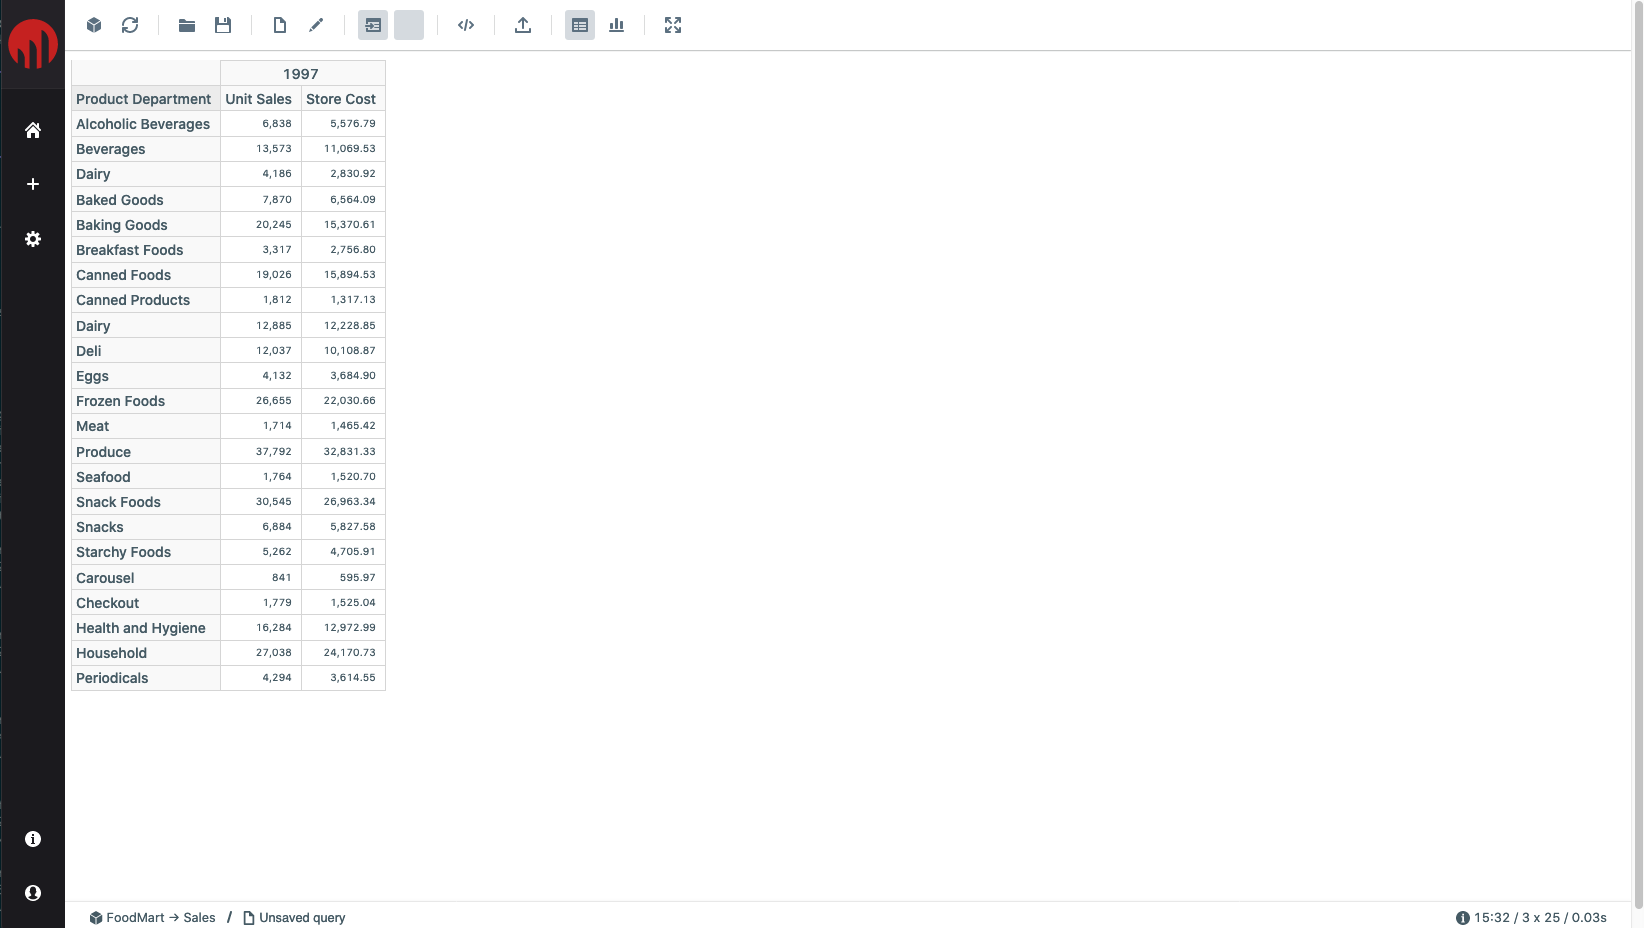
if you’d rather see a chart, click the chart icon in the toolbar, and select the chart type you would like to view
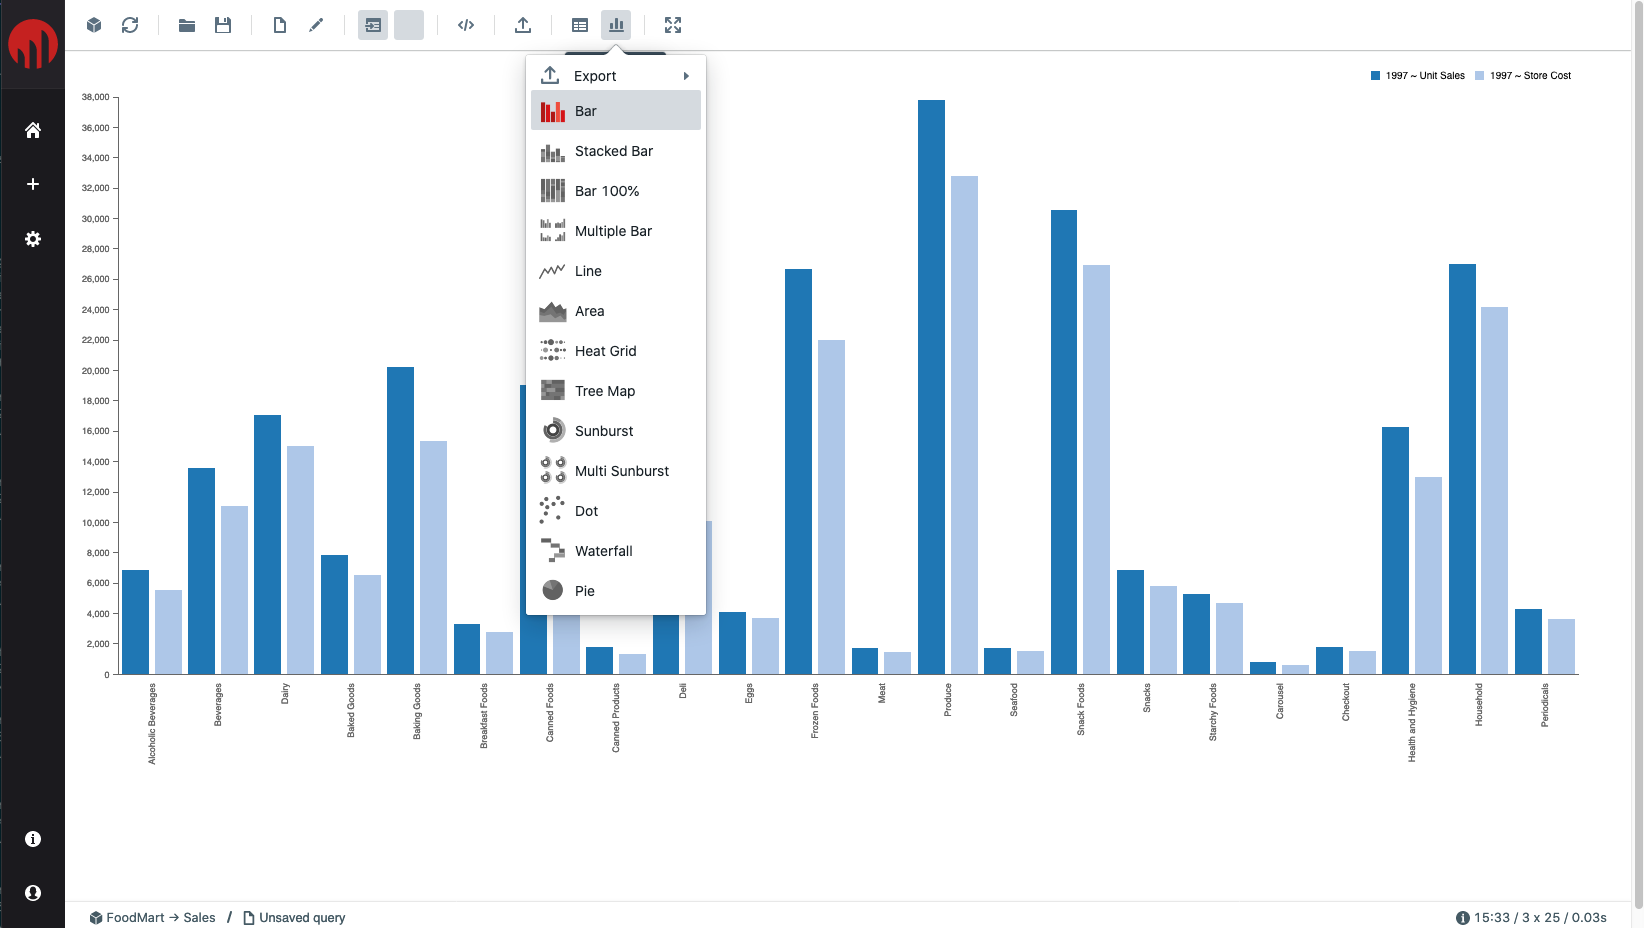
And that is about it to get started! To find out more, have a read through our other documentation and tutorials. Query Design & data source management will be good places to get going!
Feedback
Was this page helpful?
Glad to hear it! Please tell us how we can improve.
Sorry to hear that. Please tell us how we can improve.